Analyzing Monday's trades:
EUR/USD on 1H chart
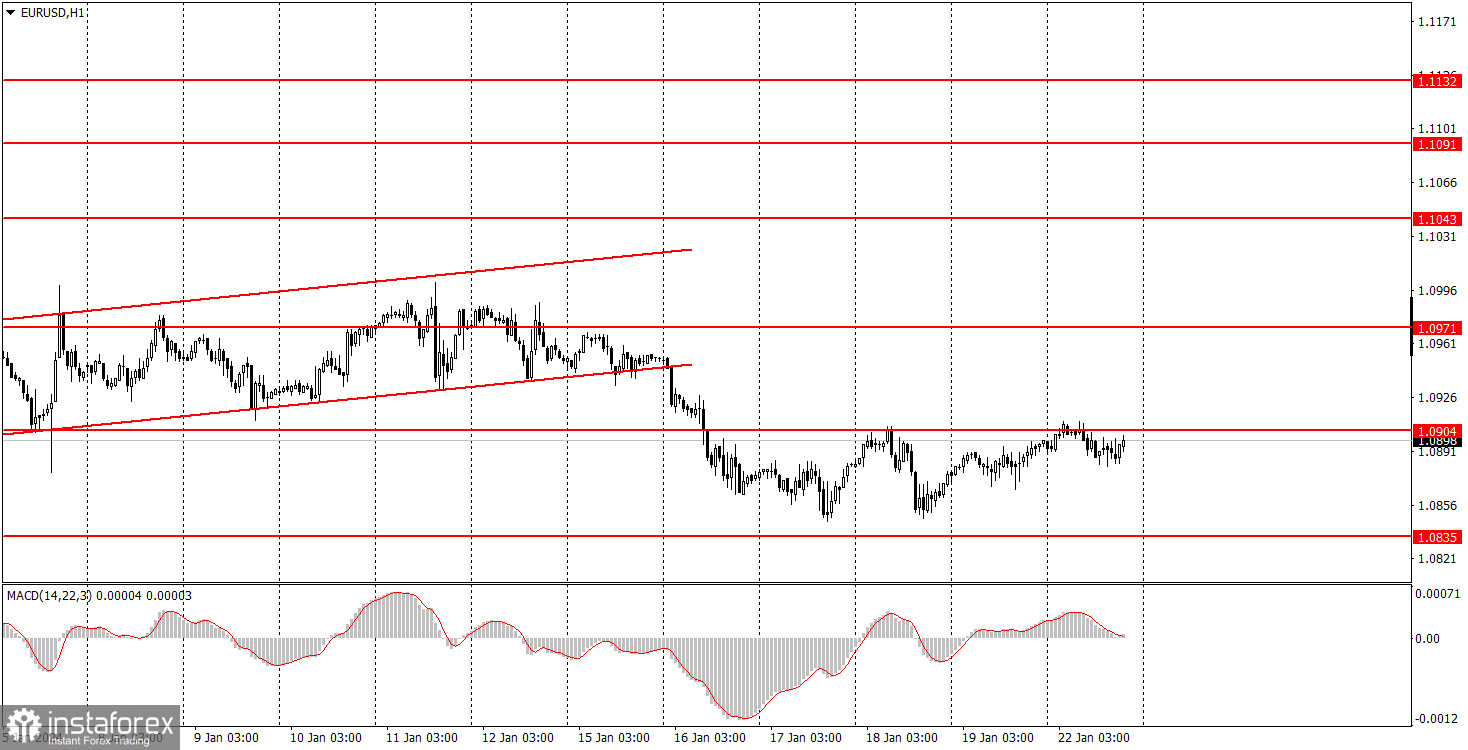
EUR/USD continued its Friday's movement on Monday. In other words, it was generally a low-volatility flat market. Last Friday, the pair traded by just 32 pips from the low to the high of the day, then on Monday, it only moved by 29 pips. EUR/USD did not show any significant movements in both cases, which can be seen on the chart of any timeframe. Therefore, there is nothing to analyze. European Central Bank President Christine Lagarde's speech was scheduled on Monday, but it suddenly disappeared from the calendar of events. So we can assume that either the speech was canceled or it was just an error. Either way, there were no significant events on Monday, not even secondary ones.
The price continues to stay below the level of 1.0904, maintaining the possibility of bringing back the downward movement at any moment. There won't be any important events on Tuesday either, but we can expect them to appear later in the week. Therefore, we expect higher volatility in the second half of the week. Until then, we are stuck with a flat market.
EUR/USD on 5M chart
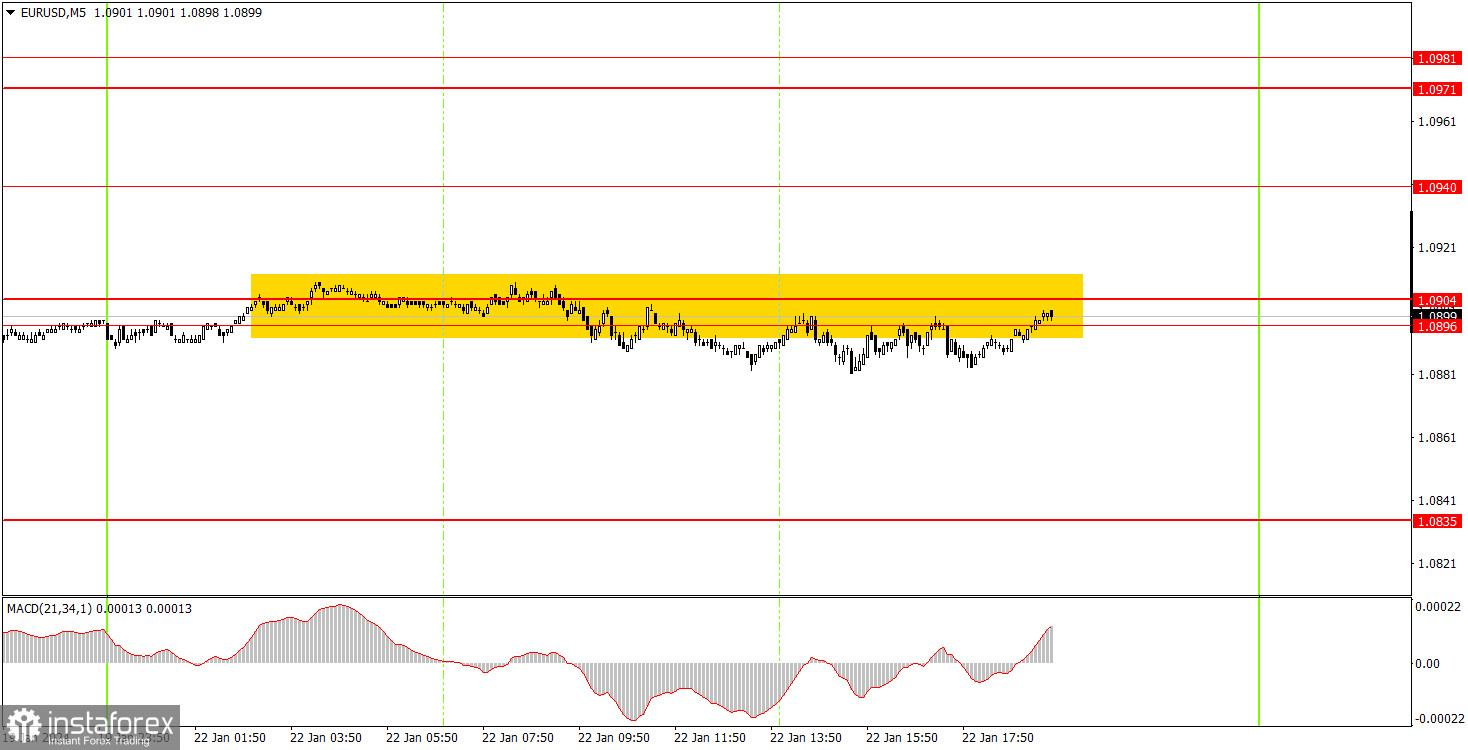
There were no trading signals generated on the 5-minute timeframe. The price mostly moved sideways within the range of 1.0896-1.0904. Formally, the pair either stayed below this range or bounced off it, which makes it unclear. However, even if novice traders opened short positions, they could have closed them at any time without losing anything, as the price did not show any significant movements.
Trading tips on Tuesday:
On the hourly chart, EUR/USD finally has a chance of forming a new downtrend since it settled below the ascending channel. Perhaps the market has finally changed its attitude towards the euro and the dollar, so the pair should continue to fall by another 500-600 pips. But for now, we can see that the pair lacks distinct movement.
On Tuesday, we expect further downward movement since several sell signals have already formed around the area of 1.0896-1.0904. Therefore, it is advisable to stay in short positions (or open new ones on rebounds) with a target of at least 1.0835. In the long run, we expect a much stronger decline.
The key levels on the 5M chart are 1.0733, 1.0767-1.0781, 1.0835, 1.0896-1.0904, 1.0940, 1.0971-1.0981, 1.1011, 1.1043, 1.1091, 1.1132-1.1145, 1.1184, 1.1241, 1.1279-1.1292. On Tuesday, there are no important events lined up in either the European Union or the United States. Not even secondary events. Therefore, we might witness a flat market with low volatility.
Basic trading rules:
1) Signal strength is determined by the time taken for its formation (either a bounce or level breach). A shorter formation time indicates a stronger signal.
2) If two or more trades around a certain level are initiated based on false signals, subsequent signals from that level should be disregarded.
3) In a flat market, any currency pair can produce multiple false signals or none at all. In any case, the flat trend is not the best condition for trading.
4) Trading activities are confined between the onset of the European session and mid-way through the U.S. session, after which all open trades should be manually closed.
5) On the 30-minute timeframe, trades based on MACD signals are only advisable amidst substantial volatility and an established trend, confirmed either by a trendline or trend channel.
6) If two levels lie closely together (ranging from 5 to 15 pips apart), they should be considered as a support or resistance zone.
How to read charts:
Support and Resistance price levels can serve as targets when buying or selling. You can place Take Profit levels near them.
Red lines represent channels or trend lines, depicting the current market trend and indicating the preferable trading direction.
The MACD(14,22,3) indicator, encompassing both the histogram and signal line, acts as an auxiliary tool and can also be used as a signal source.
Significant speeches and reports (always noted in the news calendar) can profoundly influence the price dynamics. Hence, trading during their release calls for heightened caution. It may be reasonable to exit the market to prevent abrupt price reversals against the prevailing trend.
Beginning traders should always remember that not every trade will yield profit. Establishing a clear strategy coupled with sound money management is the cornerstone of sustained trading success.